|
Psychrometric Algorithms This
product provides the most accurate and reliable data based on dozens of
formulations developed by R. W. Hyland and A. Wexler, in whose reports
published by
ASHRAE, dry air,
water vapor and moist air are all treated as real gases, rather than
ideal gases. |
Ranges in SI units:
- Barometric pressure: any value between 20,000 and 500,000 Pa, or
between 150 and 3,750 mmHg
- Dry-bulb temperature: -50 to 200 deg C
- Humidity ratio: 0 to 120 g(water)/kg(dry air)
|
Ranges in I-P units:
- Barometric pressure: any value between 2.9 and 72.5 psi, or
between 5.906 and 147.65 inHg
- Dry-bulb temperature: -58 to 392 deg F
- Humidity ratio: 0 to 0.120 lb(water)/lb(dry air)
|
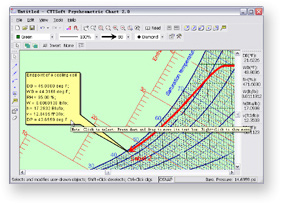
Features
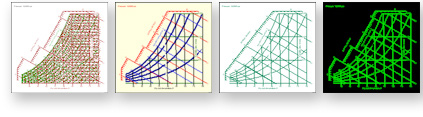
- Completely customizable chart
You can customize almost everything of the chart to suit
your preferences. The altitude, pressure, dry-bulb temperature range and
humidity ratio range can be specified by the user. Lines and curves for
different parameters are shown in different colors, widths, densities and
visibilities which can be changed by the user whenever necessary.
|
 |
 |
- Viewing chart details conveniently
The PAN/ZOOM commands, windows scroll bars, mouse wheel, and shortcut
keys (arrows, +/-, Page Up/Down, and Home/End) make you enjoy viewing every
detail of the chart with ease.
|
- Various kinds of objects drawn on the chart
You can draw points, straight lines, cooling coils, mixing lines to
represent different air conditions or processes. And any position of the
chart can be marked by a label or a note. All objects are editable! That is,
You can change their properties (including parameters and appearances) at
any time after they are created.
|
- Unlimited history
Every action you perform when creating or modifying objects on the chart is
recorded and may be undone and redone.
|
 |
- Powerful print
You can print a picture of the chart, and you can print a tabular report for
objects on this chart. Alternatively, you can export or copy them into
anther application and then print in that app.
|
- Working with other programs
You can insert a chart or report in other programs. For example, you can
export the chart (including all objects drawn on it) as a Microsoft®
Windows®-format metafile and then insert it into your AutoCAD®
drawings to edit. You can copy the chart or report to clipboard and paste it
into Microsoft Office®.
|
- And much more...
Download a
free demo version now to find more useful features! The file size is only
2.4 MB.
|